Charts
Live BTC order-flow charts
Free charts of BTC, ETH, SOL and HYPE perpetuals on Hyperliquid, on the TradingView Lightweight Charts™ engine. Footprint, delta, CVD and the order-book heatmap work from the first second, because the HyperQuant server records the last 24 hours of tape and book. No sign-up and no buy or sell signals.
Open ChartsReplay the last 24 hours
What is in Charts
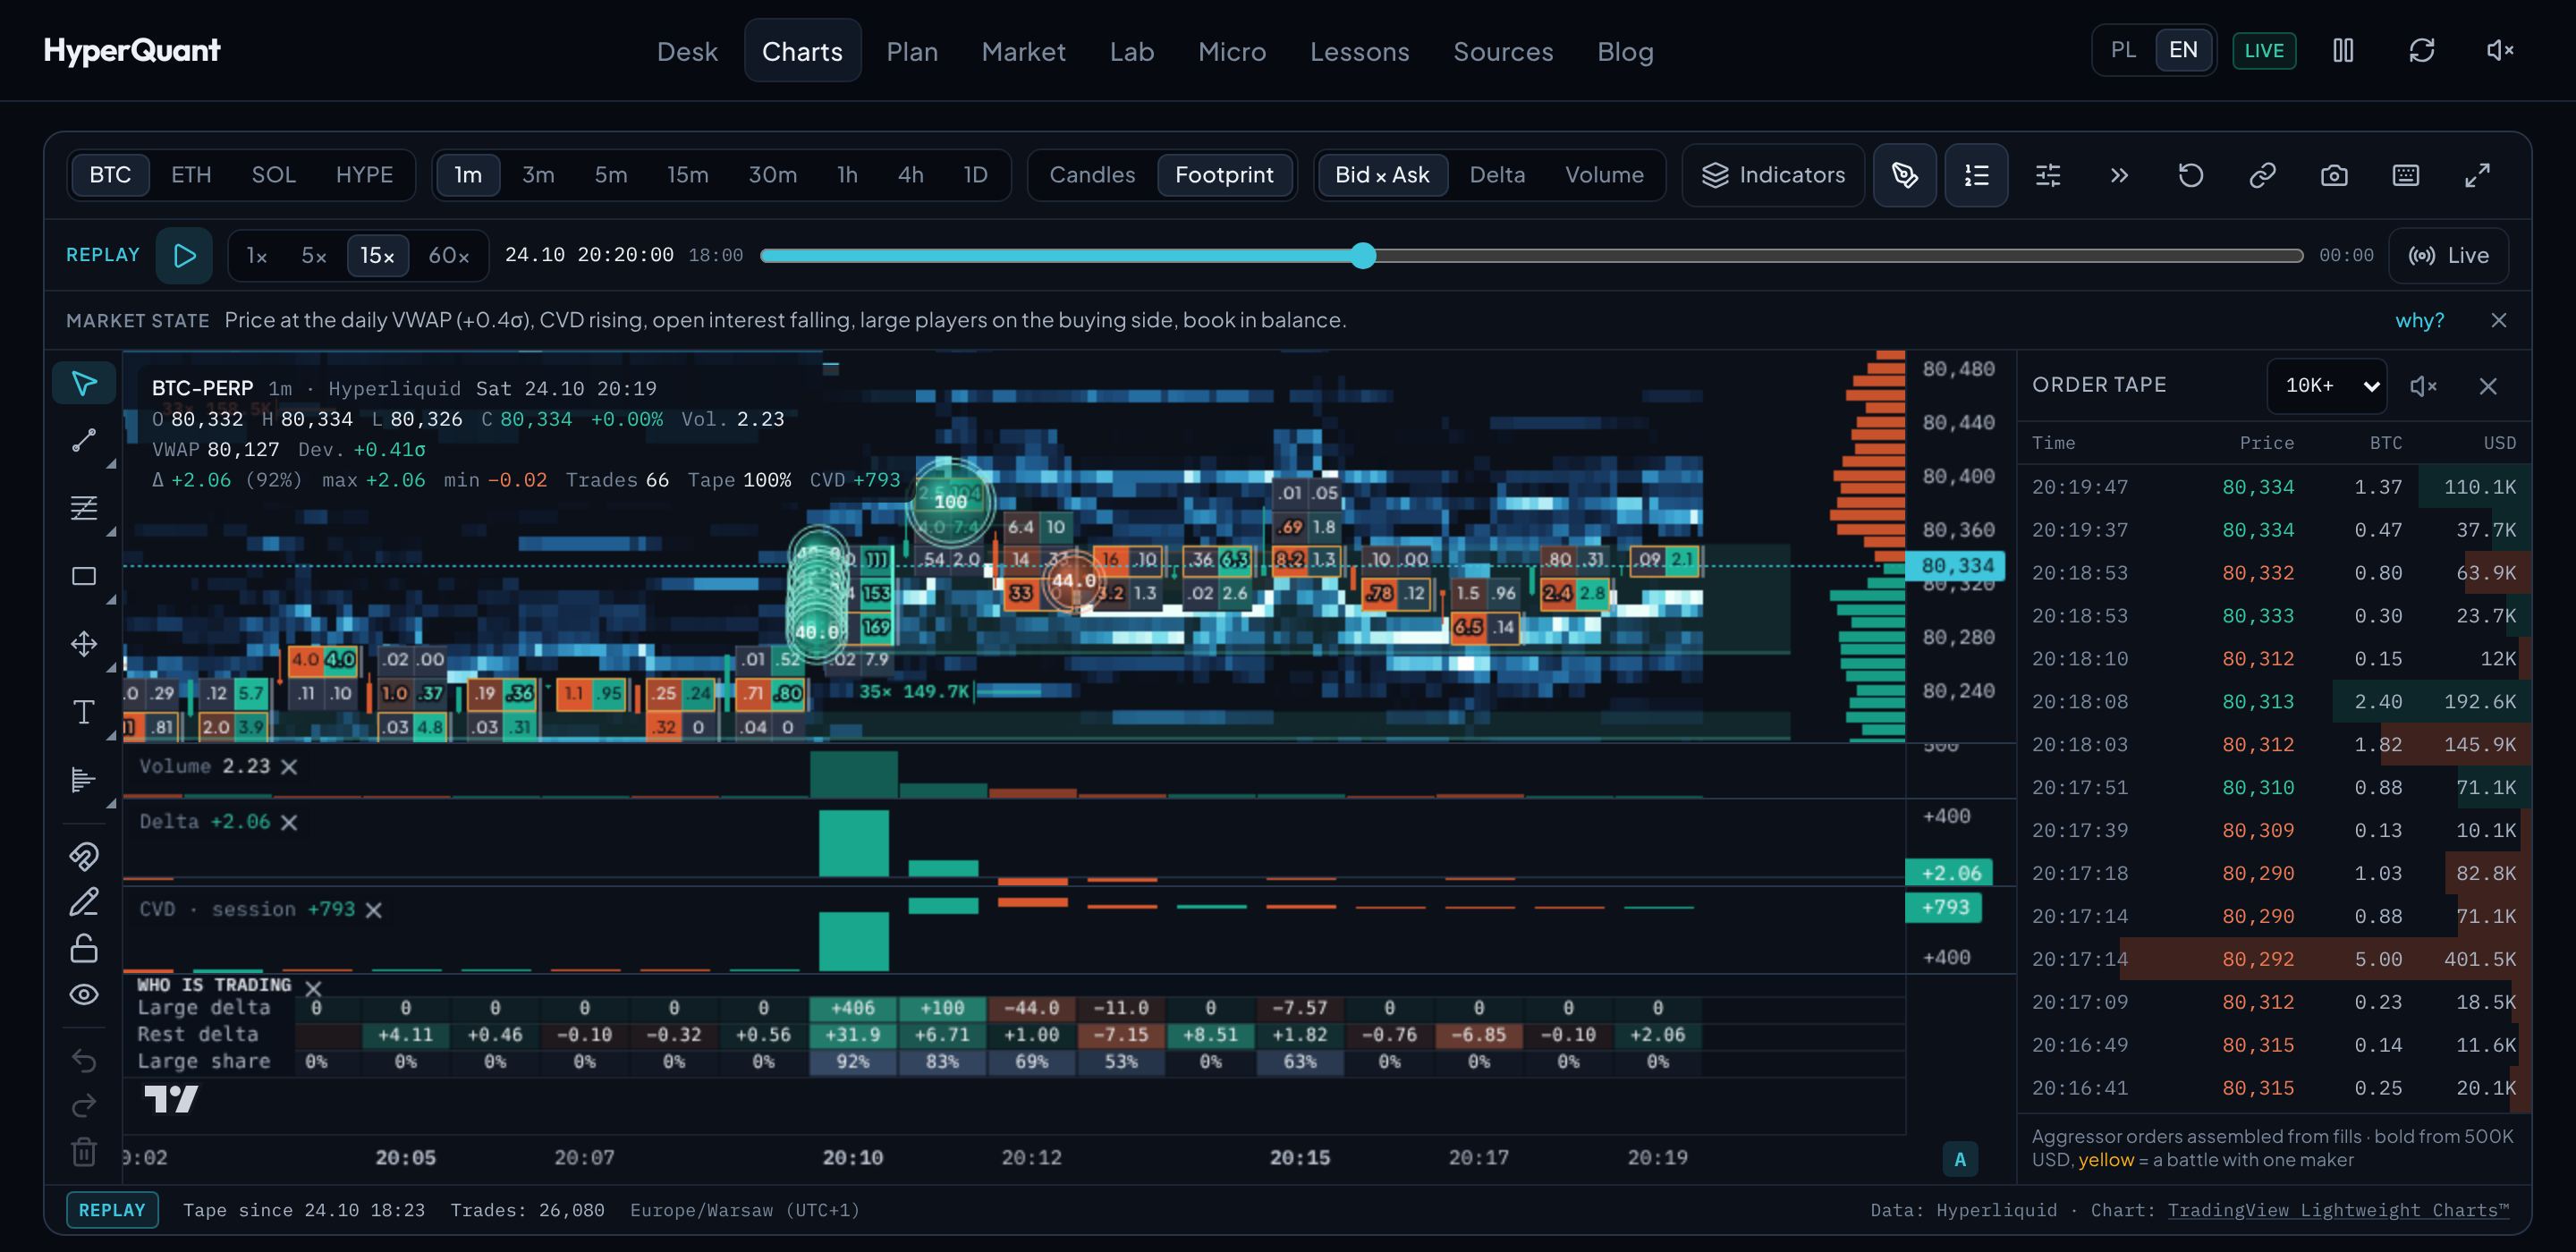
Footprint from the real tape
Every Hyperliquid trade carries the aggressor side, so the footprint is computed from the tape, not approximated. Zoomed out a candle, closer a volume profile inside the candle, closer still cells with numbers on every price row. Bid × Ask, Delta and Volume styles, POC, 70% value area, diagonal imbalances and stacked zones.
Delta, CVD and Market state
Delta candles with their extremes and CVD reset per Asia, London and New York session, UTC day or week. Market state describes the current situation in one sentence built from fixed rules, and “why?” shows the numbers behind each part. A description, not a signal.
Order book, large orders and whales
Order-book heatmap, aggressor order bubbles, bursts, maker walls, icebergs and large resting orders in the book. Whales under a pseudonym valid for one day, never with an address.
From the first second, and in replay
The last 24 hours of tape and book come from the server recording, so there is no waiting for the chart to fill. Replay plays the recorded day on the same chart at 1×, 5×, 15× or 60×, and a link opens a chosen moment.
Workstations
Start, Scalper, Liquidity, Auction, Exchanges and Two timeframes: layout, timeframes, layers and panels for one trader question in a single click. Your changes are kept as your own version of the workstation.
Indicators and drawing
Daily VWAP with ±1σ and ±2σ bands, volume profile with POC, VAH and VAL, PDH and PDL, session opens, initial balance, TPO and liquidation clusters. Drawing tools like TradingView: lines, Fibonacci, measure with volume and delta, long and short position with R:R, anchored VWAP.
On your phone
Chart, Tape, DOM and Numbers cards, one at a time, with the chart taking most of the screen. The desk installs like an app (PWA).
Data and principles
Data comes from Hyperliquid's public API and from the HyperQuant server recording in a public repository. Binance and Bybit only when you switch them on, and your own browser makes the connection. Drawings, alerts and settings stay in your browser. The code is open source (MIT licence).