Lessons
Order-flow lessons on real BTC days
Real situations from the BTC market on Hyperliquid, stopped at an important moment. You say what you see and where you would be wrong, then we reveal what happened next. We score the reasoning, not the profit: no buy/sell signals and no promised results.
Start the exercisesIndicator atlas
“What would you do?” exercises
Six real situations from 20–24 October 2026, from the basics to the footprint. Each takes a few minutes.
- Breakout at the New York openA quiet morning, a sharp break through PDH and a drop back to VWAP. Where would you be wrong?
- Trend day: +2σ is not a ceilingPrice touches the +2σ band. “Expensive, time to short”? Check what the day's context says.
- Bounce on a down dayAfter a 2,700 USD drop, price bounces to the lower edge of value. Reversal or a test from below?
- Balance day: breakouts without acceptanceA jump at the NY open, then a drop below the value area. A change of day type or two false breakouts?
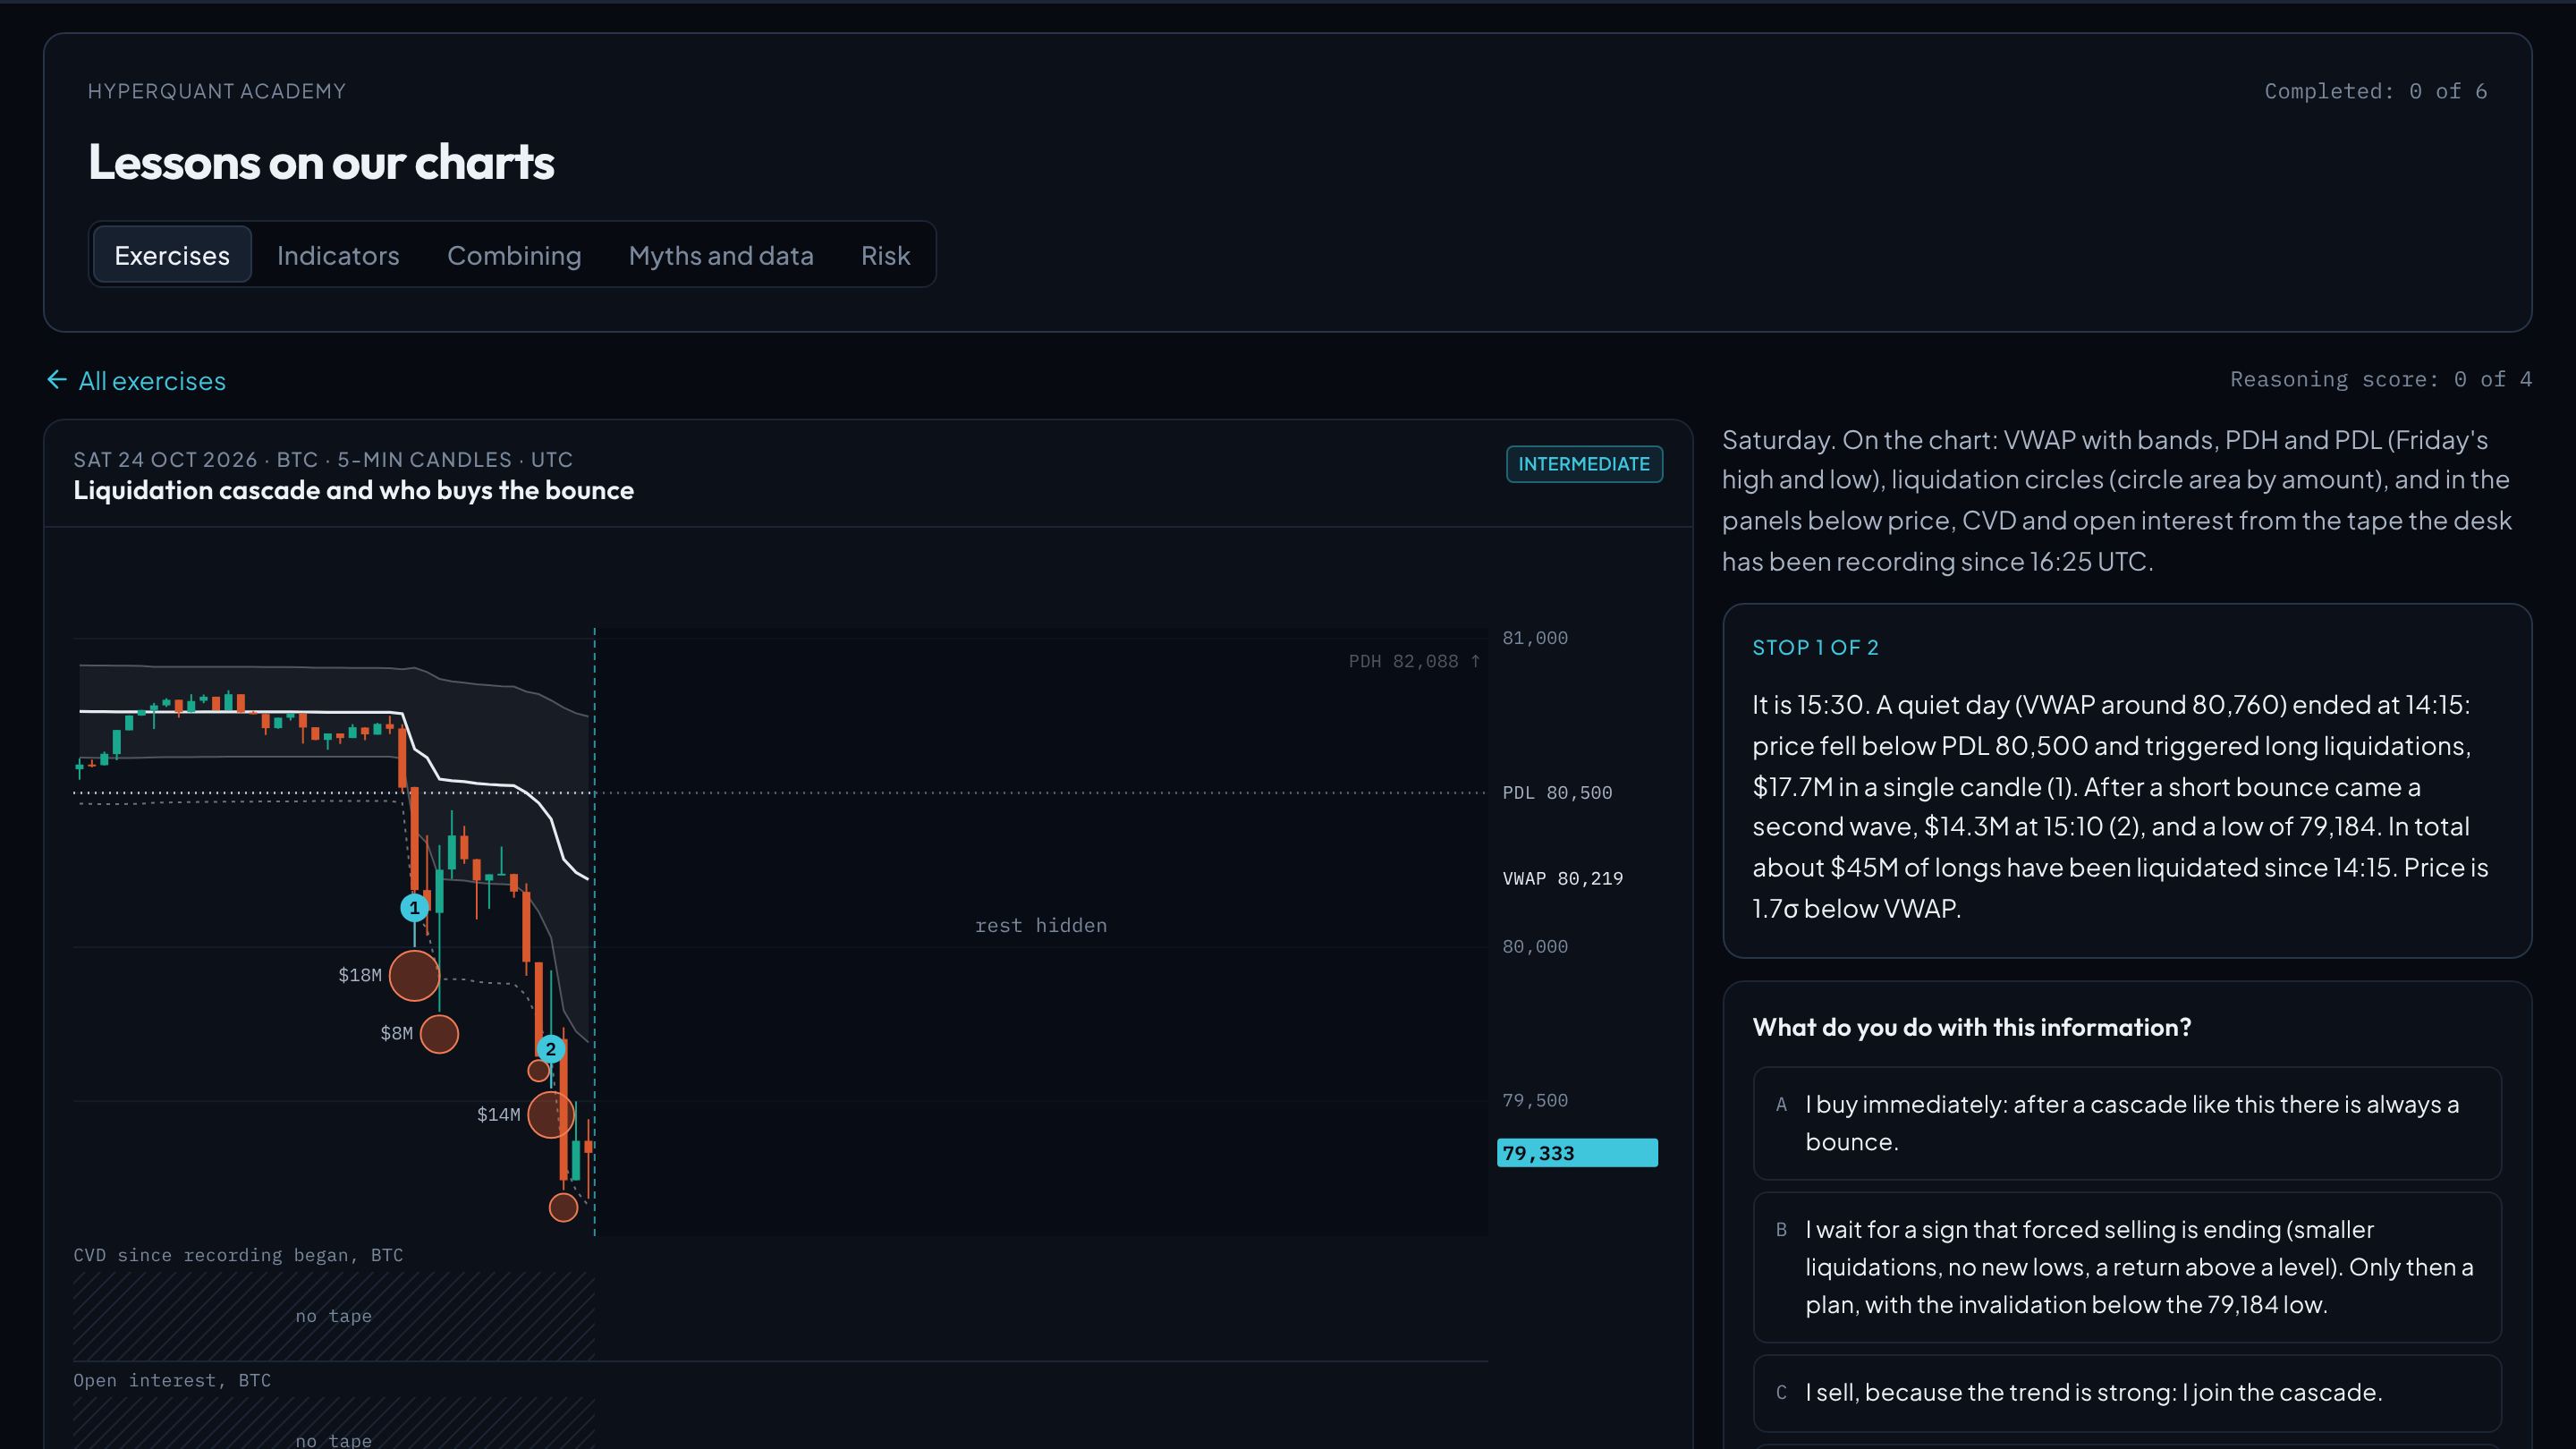
- Liquidation cascade and who buys the bounce$45M of longs liquidated below yesterday's low, then a bounce. Who is behind it?
- Footprint: an imbalance zone that did not holdAggressive buying through nine price levels. Support for sure? We read it cell by cell.
Order-flow indicator atlas
Every indicator from the Charts tab: what it is, how we compute it, how to read it, where it is easy to go wrong and what to combine it with. The figures come from the same slices as the exercises.
Price and value
- Daily VWAP and σ bandsThe day's volume-weighted average price: what everyone who traded today paid on average.
- Volume profile: POC, VAH, VALHow much traded at each price: a map of the prices the market considered fair and the ones it flew through.
- Session profiles, naked POCs and developing POCA separate profile for each session, POCs that price never returned to, and the POC computed candle by candle.
- Day profile: volume, aggression, timeMarket Profile in one picture: how much traded at each price, who was aggressive and how long the market stayed there.
- Daily levels: PDH, PDL, openThe previous UTC day's high and low and the day's open: points every market participant can see.
- Session opensThe moments when new participants enter the market: Asia, London, New York.
- Initial balance (IB)The range of the session's first hour: where the market set its first boundaries.
Flow: who is aggressive
- Footprint: Bid × Ask, Delta, VolumeInside the candle: how much aggressors bought and sold at each price level.
- Imbalances, zones and unfinished auctionsPlaces where one side clearly dominated, and candle extremes where the auction did not finish.
- Aggressor deltaThe difference between aggressive buying and aggressive selling in a candle.
- CVD: cumulative deltaThe sum of deltas since the start of a period: the direction of aggression over time.
- Aggressor order bubblesLarge market orders as circles on the chart: who hit with size, and where.
- Bursts, walls and icebergsClashes between participants computed from public trade data, without guesswork.
- Order tape (Time & Sales)A live list of trades: time, price, size, aggressor side.
- Exchange panels and the Numbers tableThe same market on three exchanges: CVD, OI change and funding from Hyperliquid, Binance and Bybit.
Order book and liquidity
- Order book heatmapResting orders over time: where liquidity stood and how it changed.
- DOM: book ladderThe current order book as a ladder: size at each price above and below price.
- Large orders in the bookBook levels with exceptionally large resting orders, and how long they stayed.
Positions and leverage
- Liquidations and liquidation clustersForced closes of leveraged positions: those that have already happened, and places where they might happen.
- WhalesThe largest positions and resting orders of the biggest Hyperliquid accounts.
- Open interest and fundingThe number of open contracts (how many positions there are) and the rate the more crowded side pays.
How to combine indicators
No indicator answers everything. Professionals combine them by question, not by the number of lines on the screen. These three questions are worth asking before every decision, in this order.
- Where am I? Type of day (VWAP, bands), value (profile, POC, VAH, VAL), daily levels, session, IB.
- Who is pushing? Footprint, delta, CVD, bubbles, tape, open interest, liquidations, exchanges.
- Where am I wrong? Structure (low, high, value edge, VWAP), position size from the distance to invalidation.
Popular rules and the data
Popular day-trading rules set against BTC history. The desk's Folklore lab counts how often each rule worked and compares that with what we would expect if price wandered randomly. Results refresh every hour.
Risk lab
The same trader with the same hit rate can survive or go bust: risk per trade decides. The simulator draws a thousand trade series with your parameters and shows what they can look like.